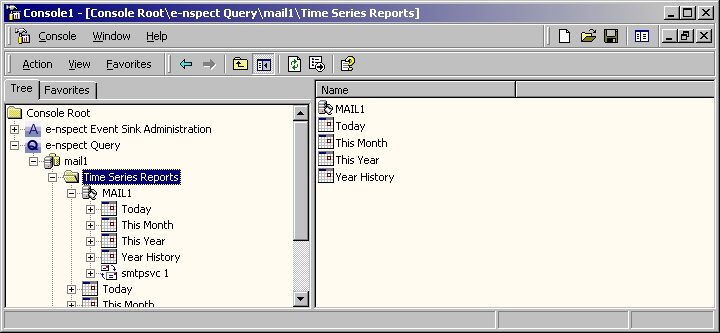
By selecting and expanding the Time Series Reports node you can view messaging use within the current day, month and year. Furthermore, such detail can be found for each SMTP host and each virtual SMTP instance.
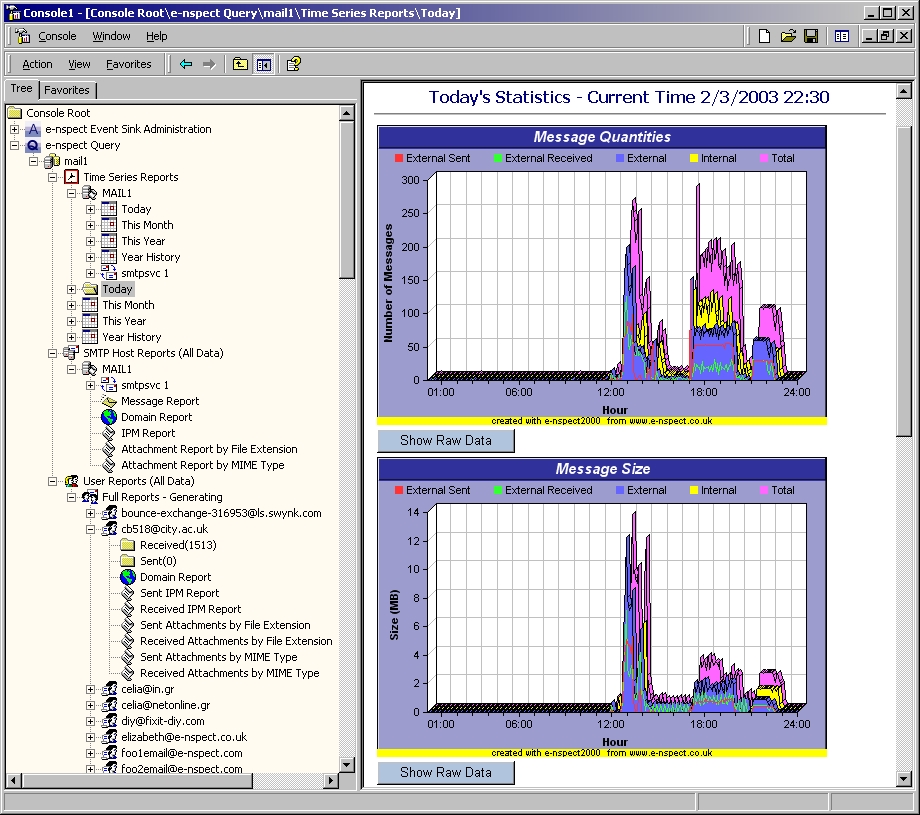
Message Quantities and Sizes are shown below. Graphs also display attachment quantities and sizes. Also, the raw data used in the creation of the graphs is also easily displayed by selecting the appropriate button.